Inflation…is it on the horizon?
Inflation is a persistent rise in the avearge level of prices over time.
--Bank of Canada
Once again the spectre of inflation is on everyone’s minds. Almost daily, I get inquiries, or at the very least, correspondence relating to this topic. But how do we really know if it has arrived and what strategies can we employ to protect our assets against its erosive power? The typical measure of inflation is the consumer price index, affectionally known as the CPI. Simply put, it measures the change in a basket of goods over time. Since 1992, Canadian consumer prices have advanced 66%, or roughly 1.80% annualized.[1] While a 1.80% average increase per year seems rather benign, it is important to identify turning points when inflation is either accelerating or decelerating in order to reposition one’s investments.
This leads us to the chart below. There are two plots here that need our attention. In the top graph we see the price history of the Commodity Research Bureau Index (CRB). The index is composed of 19 commodities in which energy represents 39%.[2] For many market analysts, the CRB’s price is a proxy for the demand of physical assets used in the global economies--aka inflation. As you can plainly see over the past 20 years, the CRB peaked back in 2008 and has been in a state of decline since then. This isn’t surprising given that crude oil peaked in the summer of 2008 at over $140 USD per barrel. The MA in this graph is the 12 month moving average that tracks the trend of the CRB. This has also been in a downtrend since the highs in 2008. Since the lows of 2020, the CRB has made a dramatic recovery. Its price has now moved above the 12 month MA which hasn’t occurred since 2018. This may be indicating a rise in inflation.
If we drop down to the bottom graph some interesting analysis can be drawn. Firstly, credit goes to technical analyst, Martin Pring, for developing and maintaining the bottom chart known as the Pring Inflation/Deflation Index Ratio. It expresses the relationship between !PRII inflation-sensitive industries such as mining and energy stocks to !PRDI deflation-sensitive industries such as insurers and utilities.[3]
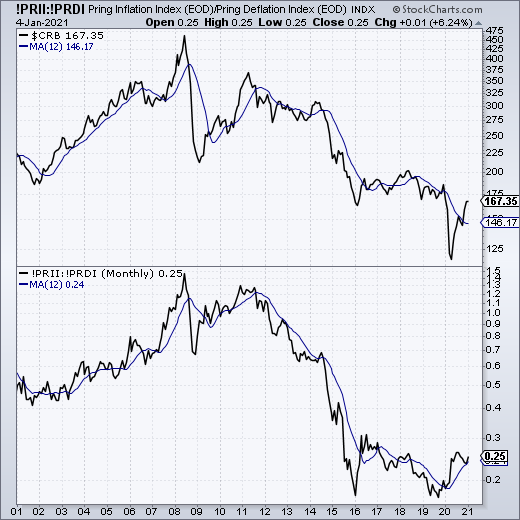
As you can see, it tracks the general shape and trend of the CRB very closely. What it does better, however, is to illustrate the relative strength of the industries in-favour vs those that are out-of-favour. Relative improvement in mining and energy stocks occurred before the CRB recovered from its COVID lows. This was an excellent entry point for those wishing to add exposure to these industries and to take advantage of the potential change in leadership from deflation to inflation. I use the word “potential” because based on my chart analysis, I would like to see the ratio close above 0.3, on a monthly basis, to complete the double bottom reversal pattern. I have found this pattern to be a reliable indication of a medium-to-long-term change in trend. If this were to occur, a more bullish stance on inflation-sensitive assets would be warranted. In other words, this would add supporting evidence that inflation is on the rise.
Keep in mind that this analysis, or any analysis for that matter, cannot be taken in isolation. Further work on an individual security level is necessary to determine if the risk-to-reward profile is reasonable. Investing is about making a decision with incomplete knowledge. Our knowledge is incomplete because we cannot possibly know all of the variables that could impact the price of an investment. What we can do, however, is to use “the balance of evidence” from multiple sources to give us an edge and improve returns.
The enclosed article expresses the opinions of writer, Patrick A. Choquette, and not necessarily those of Raymond James Ltd. (“RJL”). Statistics, factual data and other information are from sources believed to be reliable but accuracy cannot be guaranteed. It is furnished on the basis and understanding that Raymond James Ltd. is to be under no liability whatsoever in respect thereof. It is for information purposes only and is not to be construed as an offer or solicitation for the sale or purchase of securities. Raymond James Ltd. is a Member - Canadian Investor Protection Fund.
[1] Source: YCharts.
[2] https://www.investopedia.com/terms/c/crb.asp
[3] See https://school.stockcharts.com/doku.php?id=market_indicators:prings_inflation_deflation for a more detailed description and methodology.


![]()